By the numbers
The rise and rise of continuation vehicles
Along with the overall secondary market, GP-led deals had a record 2024, with the majority of volume coming from continuation vehicle (CV) transactions.
As these deals have grown in popularity, assets under management (AUM) in CVs swelled to nearly US$70bn last year, from less than US$10bn in 2019, according to analysis by PwC. Private equity has clearly led the charge, but 2024 also saw growth in private debt, real estate and infrastructure CV AUM.
Similarly, the US CV market still dominates, but European CV AUM has also increased substantially over the past two years as this deal type has provided liquidity options for limited partners in a period when exits have been slow to come through.
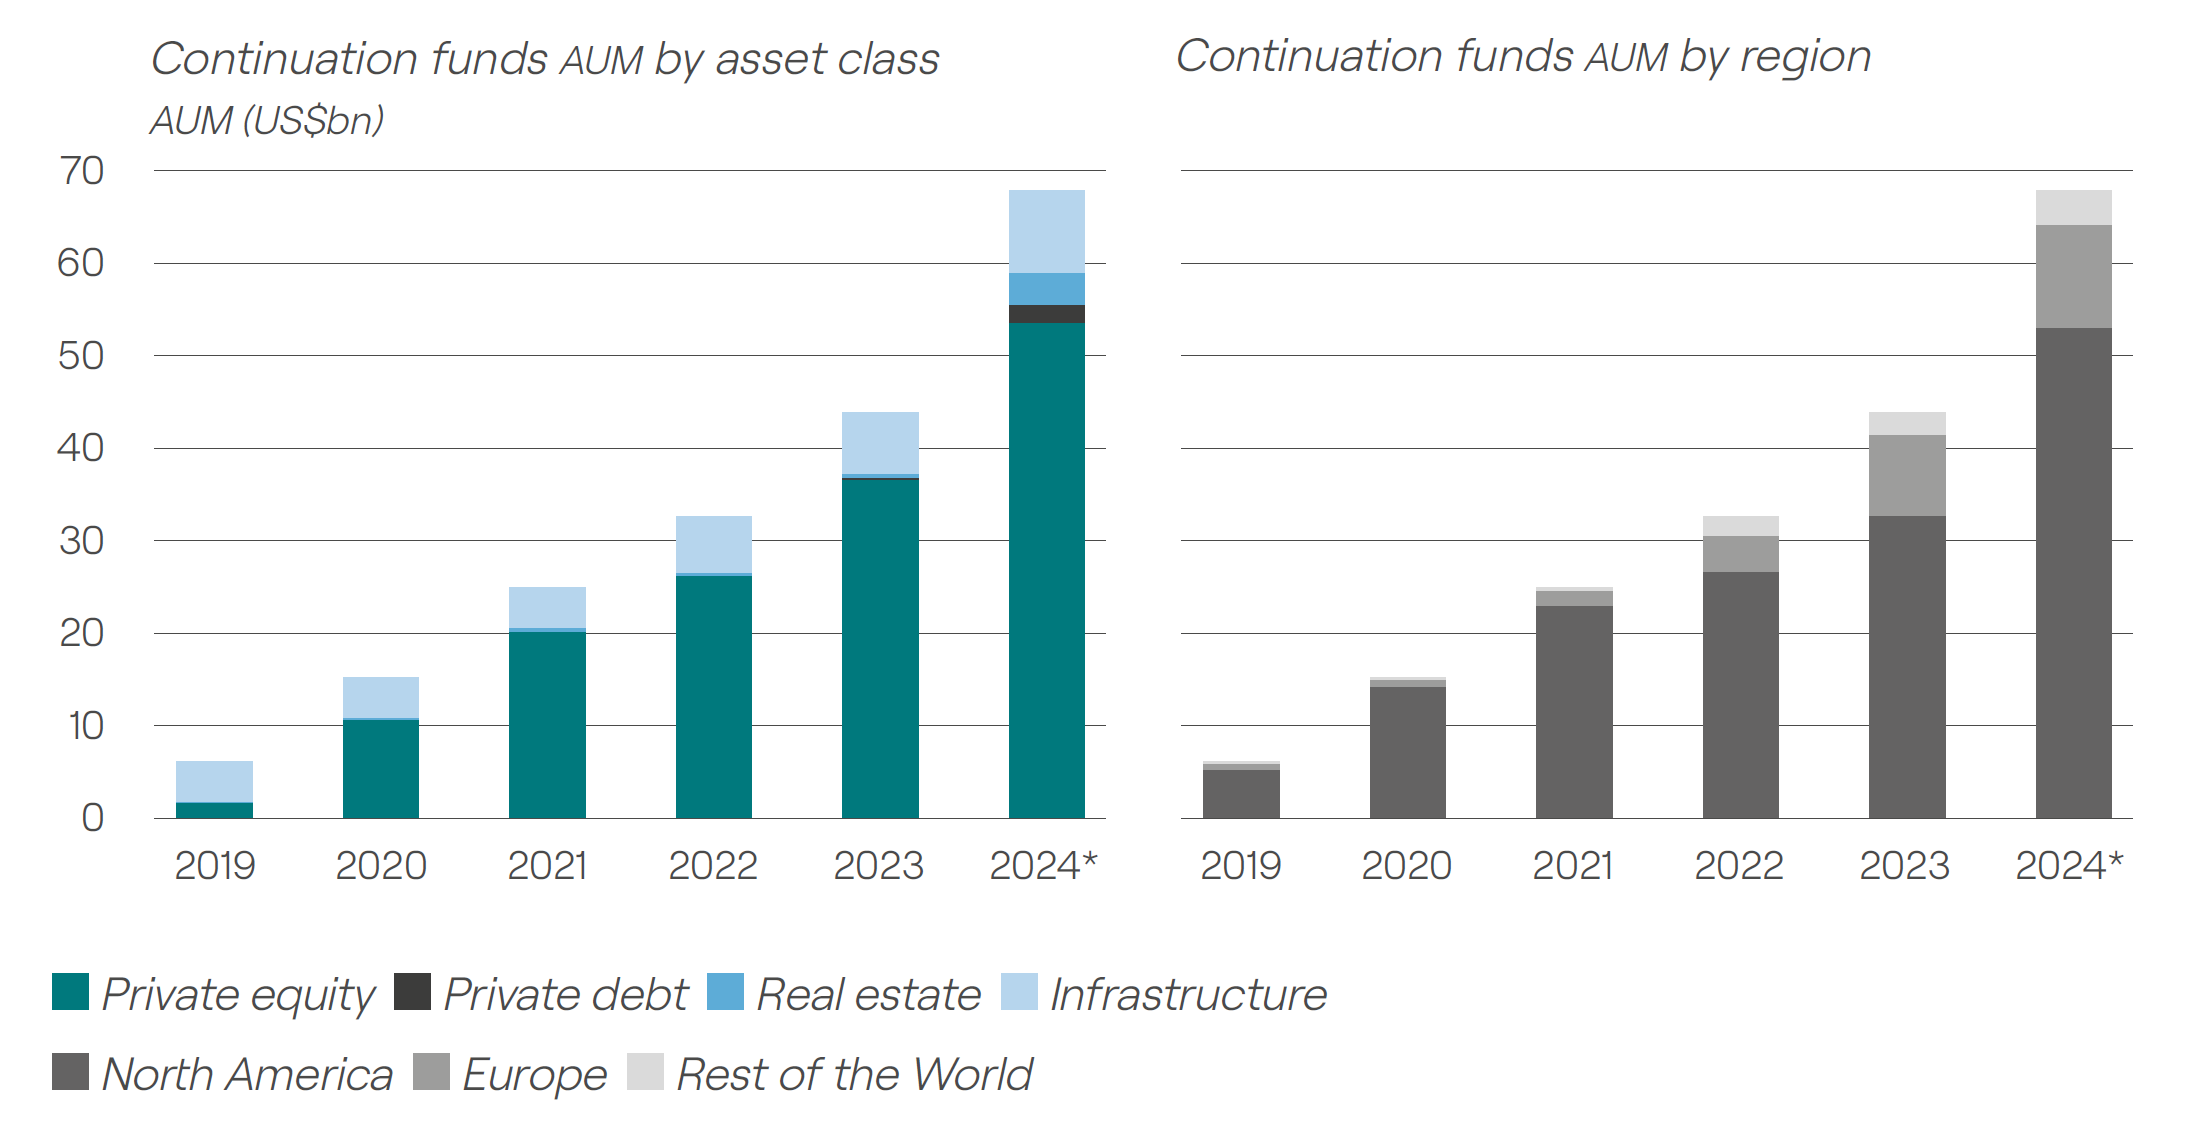
Data excludes funds of funds and secondaries.
2024* represents an estimate based on preliminary year-end data.
Sources: PwC, PwC AWM & ESG Research Centre (Luxembourg), Preqin
Re-up refusals signal portfolio shifts
Over the next 12 months do you expect to refuse a re-up with any of your existing managers?
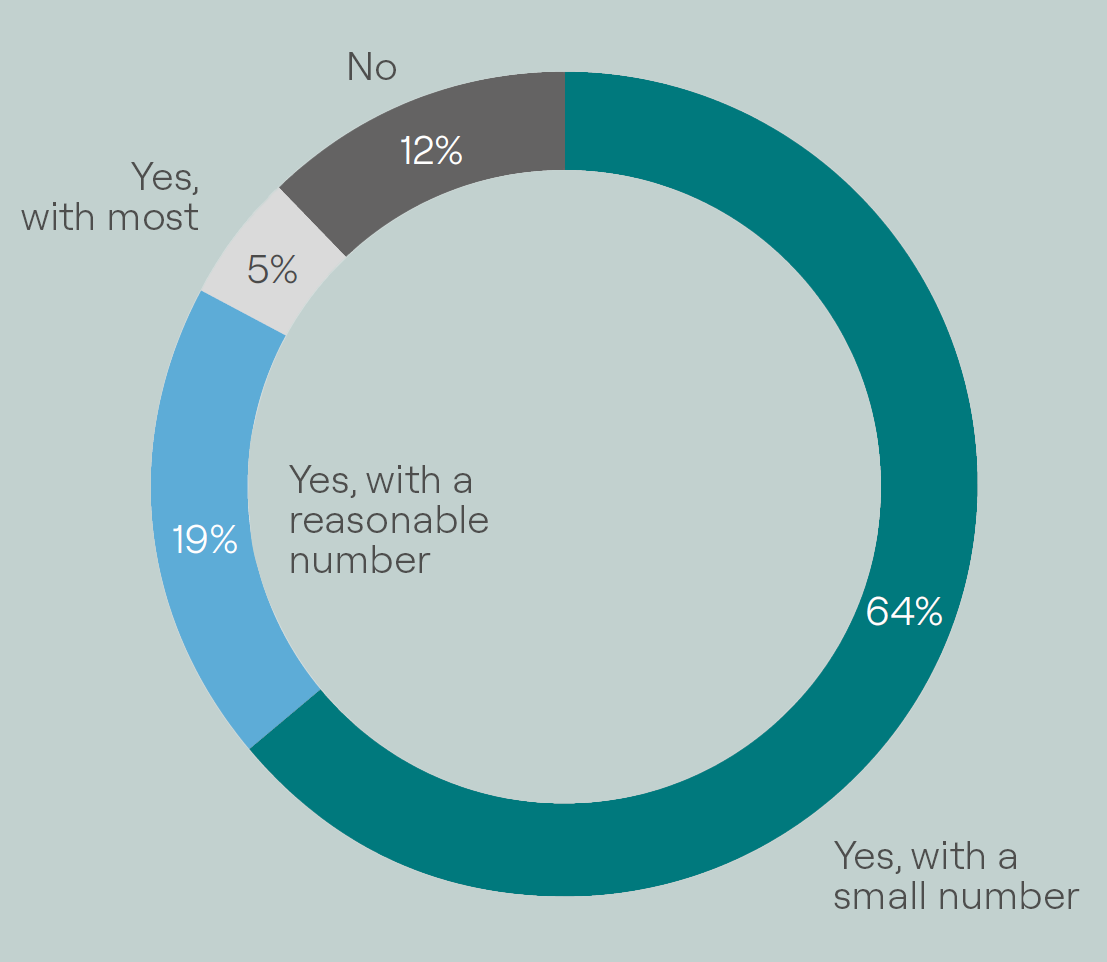
Negative cash flows from PE portfolios have clearly taken their toll on LPs’ capacity to invest in new funds. Over three quarters (79%) of LPs surveyed for Coller Capital’s Global Private Capital Barometer, Winter 2024-25, had declined to re-up with a current GP in the previous 12 months.
Of these, 42% did so because of performance, but nearly a third (29%) cited their institution’s capital availability and a further 16% a change in their institution’s strategy.
With 88% expecting to refuse a re-up in the coming 12 months, the signs are that LPs are revisiting their manager selection processes in a tough fundraising environment to focus on the best quality managers that best meet their risk and return objectives.
Source: Coller Capital, Global Private Capital Barometer, Winter 2024-25
Institutional commitments to net zero strengthen
What is your organisation’s policy on making a commitment to achieving net-zero emissions?
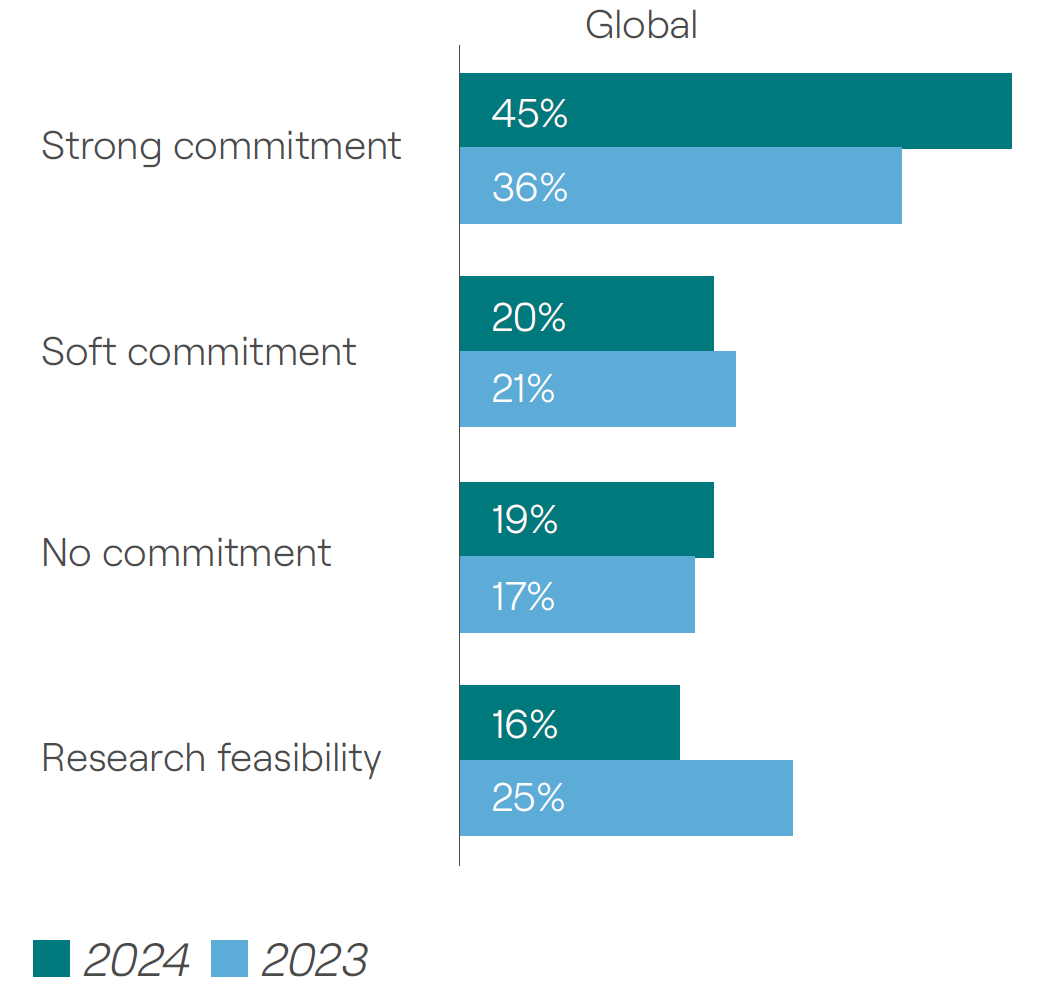
Commitments to net-zero initiatives have strengthened globally over the past year, according to Aviva Investors’ Private Markets Study 2025, a survey of 500 institutional investors worldwide, conducted at the end of 2024. In 2023, 36% had a strong commitment to achieving net-zero emissions, a proportion that rose to 45% in 2024.
Larger institutions (with over US$20bn in AUM) are more likely to have made commitments and set interim goals, with 60% having said this; just 30% of smaller institutions have made a similar level of commitment.
There are also geographic variations. Among European institutions, 50% have made strong commitments and just 13% have no commitment. Under a third (29%) of North American institutions have strong commitments, although this is up from 22% in 2023.
In Asia-Pacific, 46% have strong commitments, up from 36% in 2023, but there has also been an increase in the proportion of those making no commitment, from 10% in 2023 to 21% in 2024. The survey notes that hesitancy among Chinese institutions is largely driving this trend.
Source: Aviva Investors, Private Markets Study 2025
LPs more optimistic for 2025 PE performance
How will the next 12 months’ performance compare with previous 12 months?
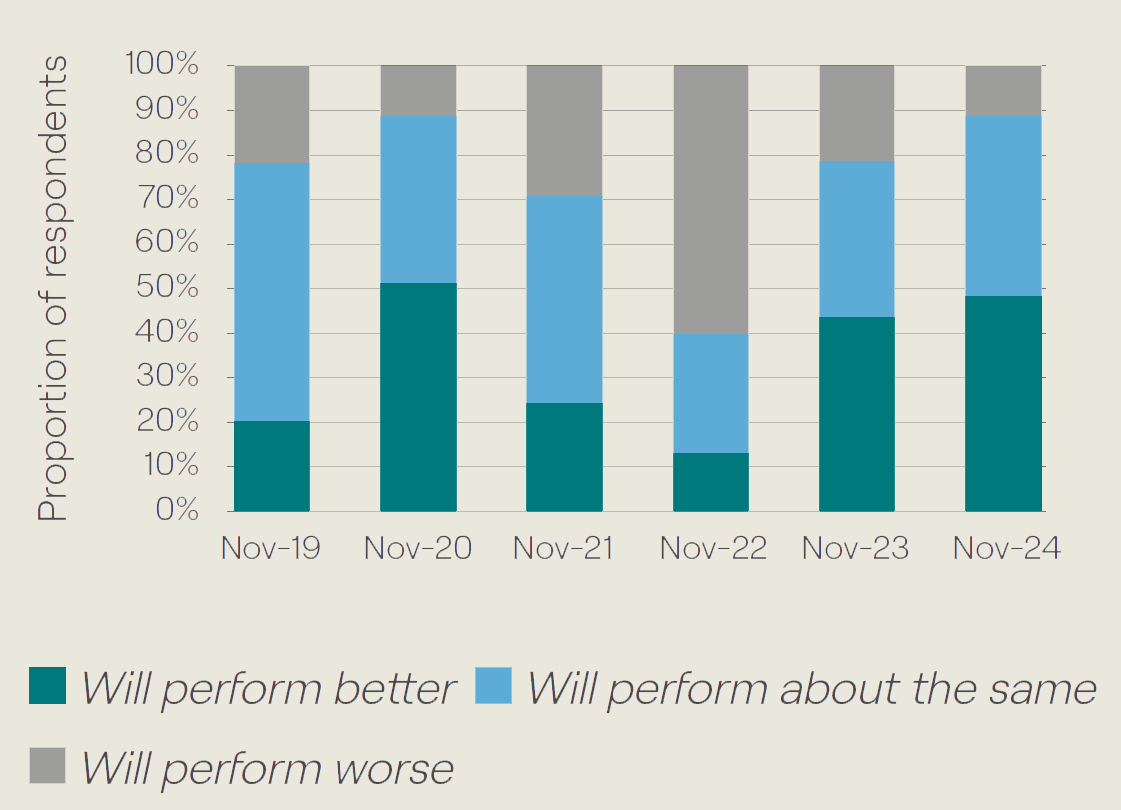
Investor expectations for PE performance for the coming year are more optimistic than they have been for some time, according to a Preqin investor survey conducted in November 2024. Just 11% of LP respondents are expecting performance to be worse than last year, compared with 21% in the 2023 survey and 60% in 2022. Around half (49%) expect returns to be better than the previous year this time around, after falling to 14% in 2022.
Source: Preqin investor surveys 2019-2024
US PE exit backlog stacking up
PE-backed company inventory by year deal
The number of companies in US PE portfolios has continued to grow as new investments have outpaced exit activity over the past decade, creating an exit backlog. By the end of 2024, there were nearly 12,000 US PE-backed portfolio companies, up from just over 7,000 in 2014, according to Pitchbook figures.
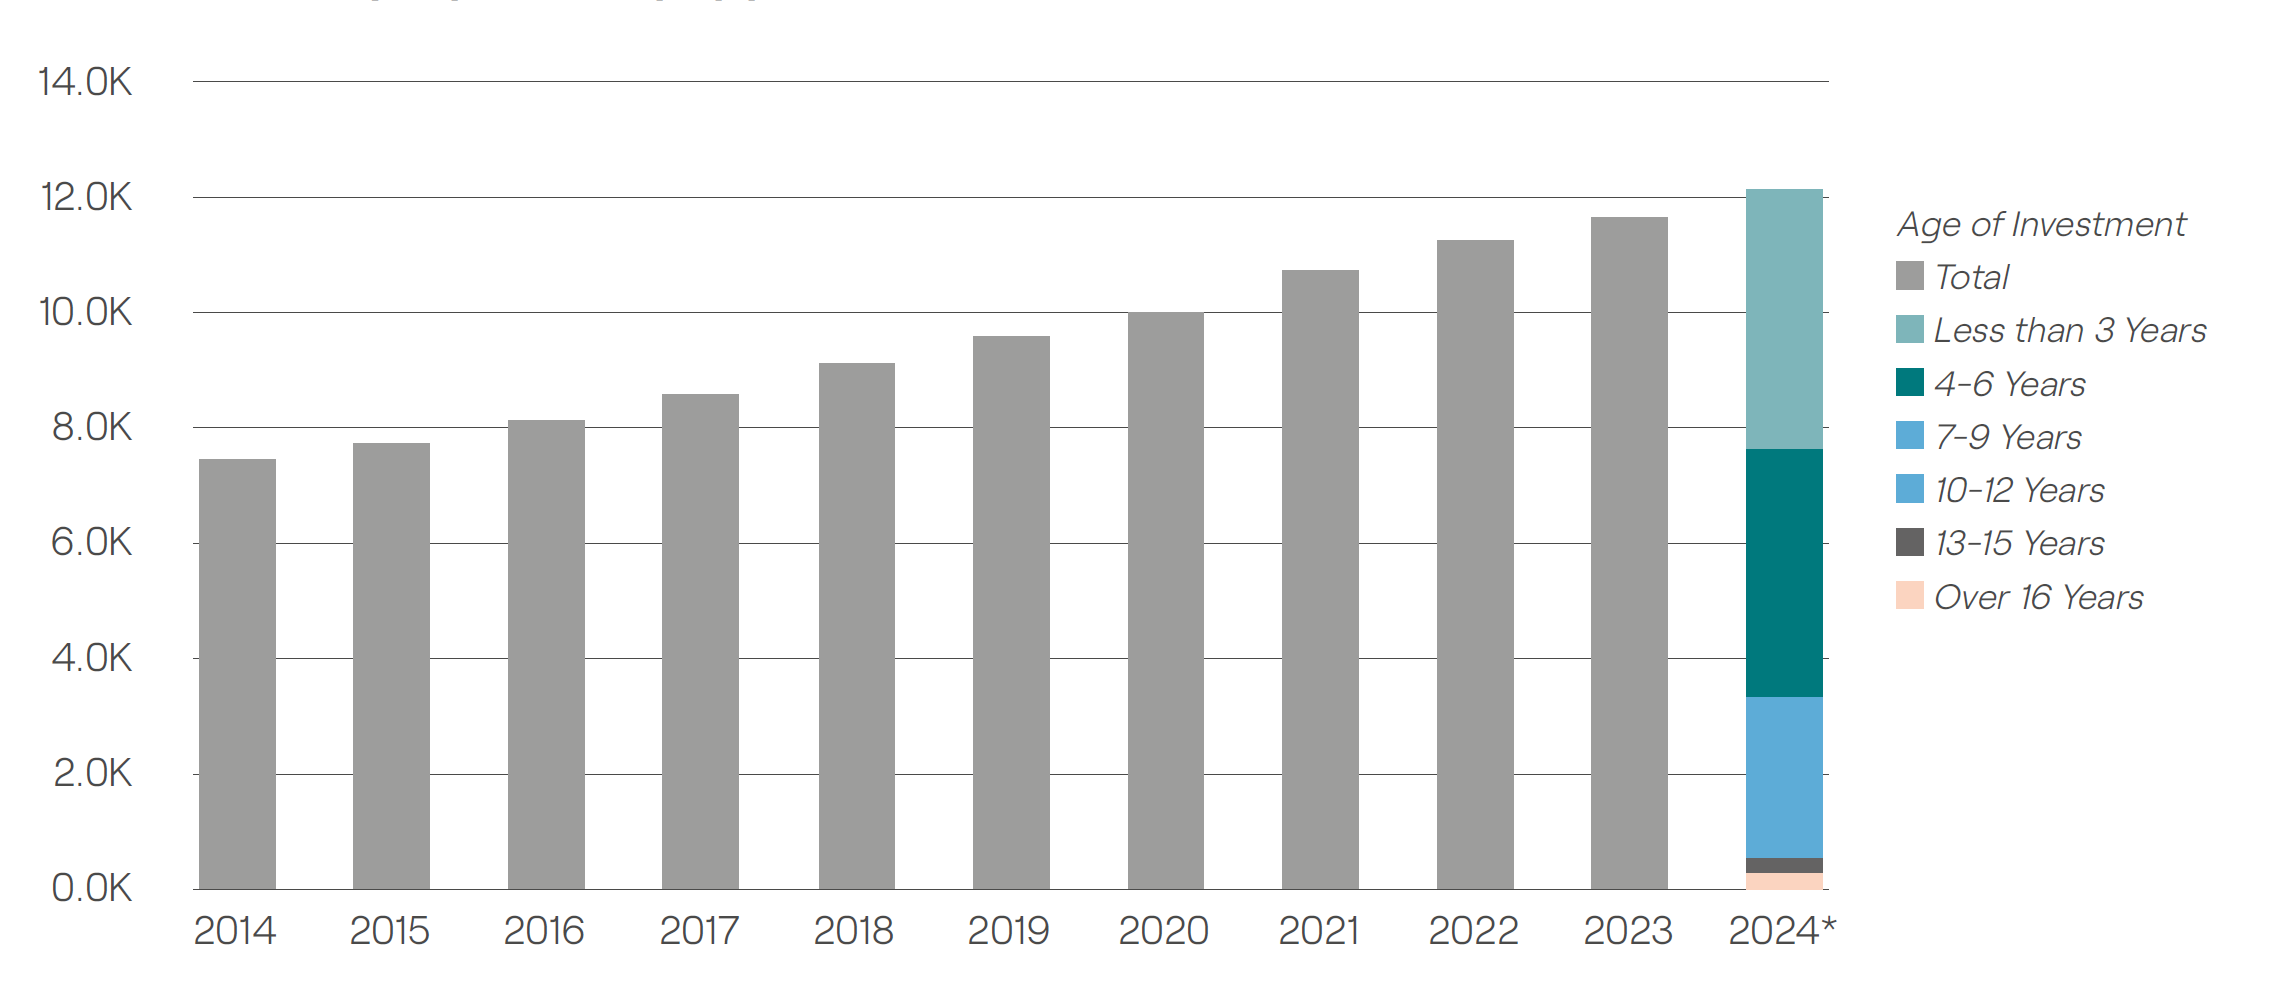
A majority of companies in the 2024 portfolio are investments made four or more years ago, with over a quarter being seven or more years old.
An increase in US PE exit volume in 2024 to 1,501 (from 1,287 in 2023) has not been sufficient to make a dent in the inventory. However, annual median hold periods for exited companies did fall from seven years in 2023 to five years, seven months in 2024.
Source: Pitchbook Geography: US
*As of December 31, 2024